This project aimed to assess the potential of soil organic carbon (SOC) sequestration in African savannah rangelands as well as review the current state of the art of SOC monitoring. With this in mind, three deliverables were produced:
• D1: A systematic literature review of the effects of management practices on SOC sequestration in African savannahs and rangelands.
• D2: A review of available SOC Digital Soil Maps (DSMs) and their potential to capture changes in SOC stocks over time.
• D3: A cost-benefit analysis of the benefits of improved monitoring of SOC sequestration in a carbon project.
• D4: Consolidated recommendations and implications for carbon projects based on D1-D3.
This dashboard presents the main findings, data and analyses from these deliverables. The work was executed by TerraCarbon, World Agroforestry (ICRAF) and funded by Apple through Conservation International.
Papers screened
567
Papers reviewed
141
Papers included
42
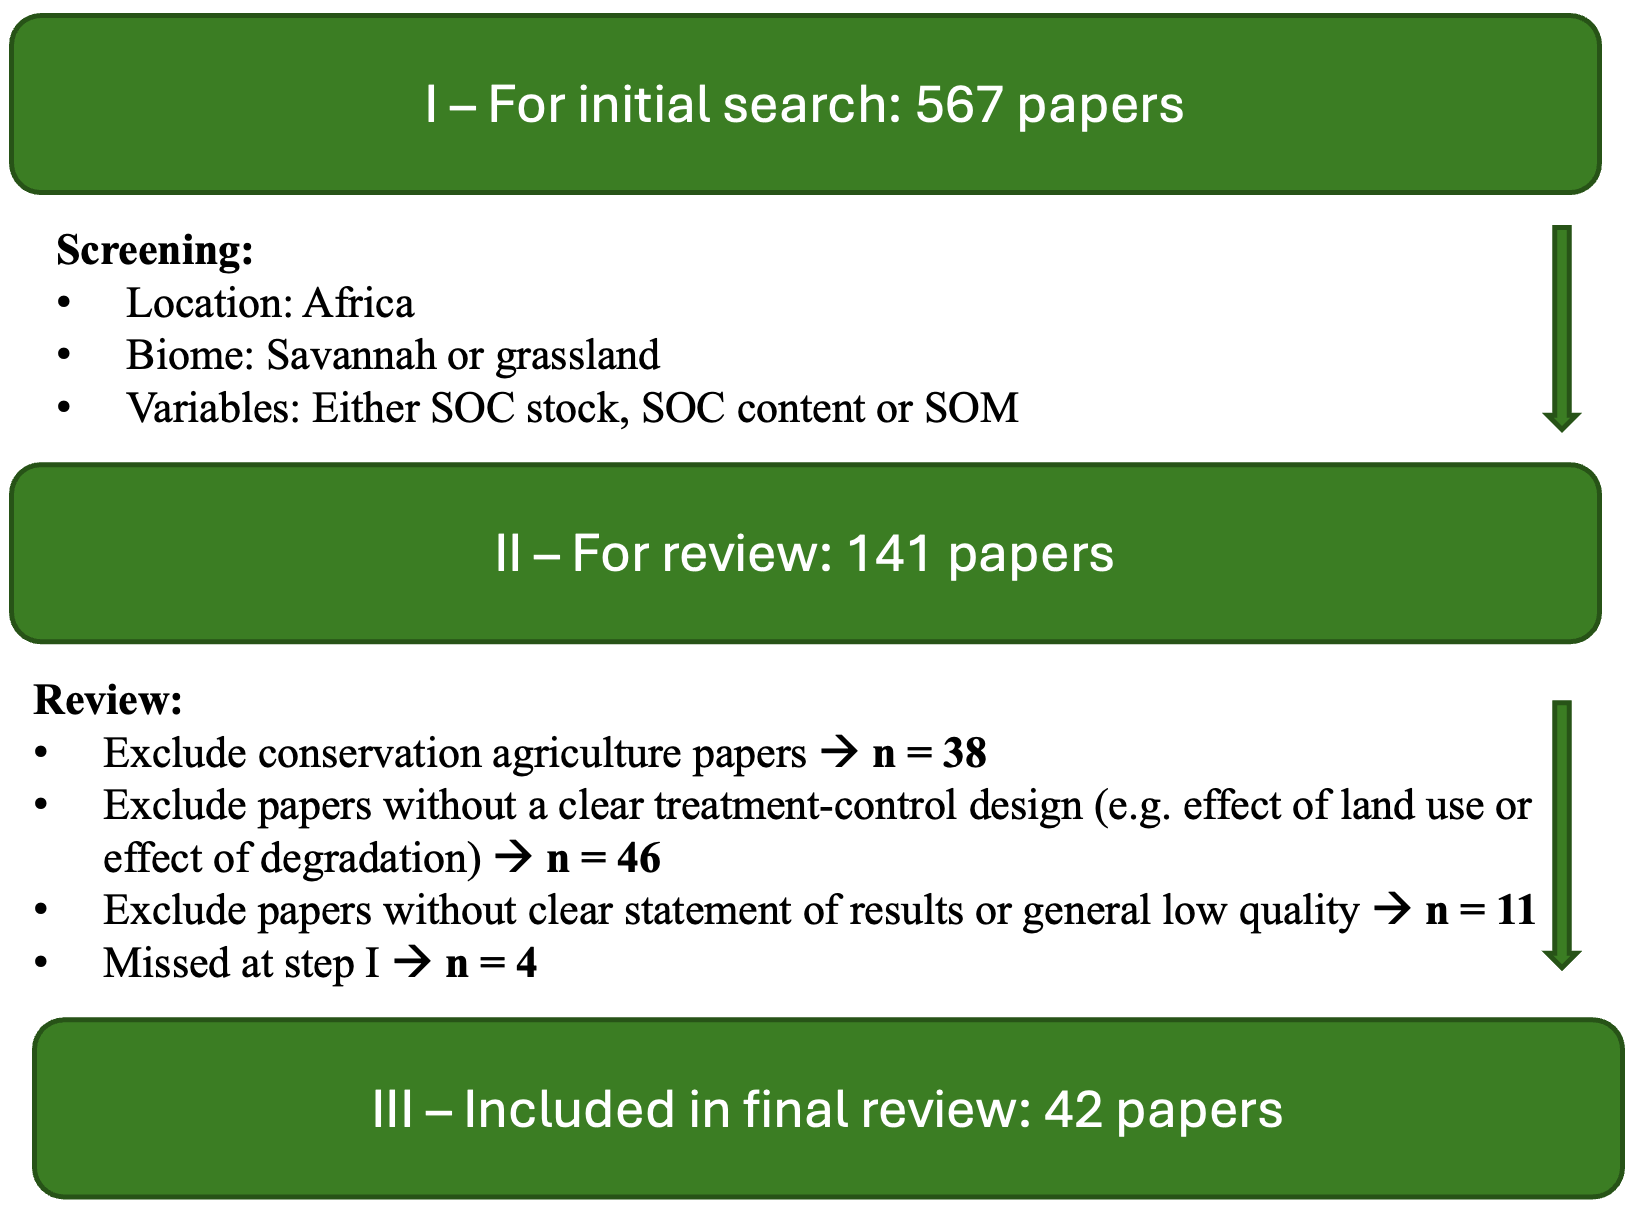
A thorough systematic literature review was conducted to understand:
The availability and distribution of peer reviewed and gray literature relating to soil organic carbon content, stocks, and stock change in African savanna systems under varying management and restoration activities, including research and data gaps.
The strength of evidence of SOC impacts stemming from changes in land management and restoration; and
The potential for various land management and restoration activities to serve as SOC sequestration pathways underpinning carbon offset projects in the Voluntary Carbon Market.
To answer these questions, we screened 567 papers, reviewed 141 and, finally, included 42 papers in the review.
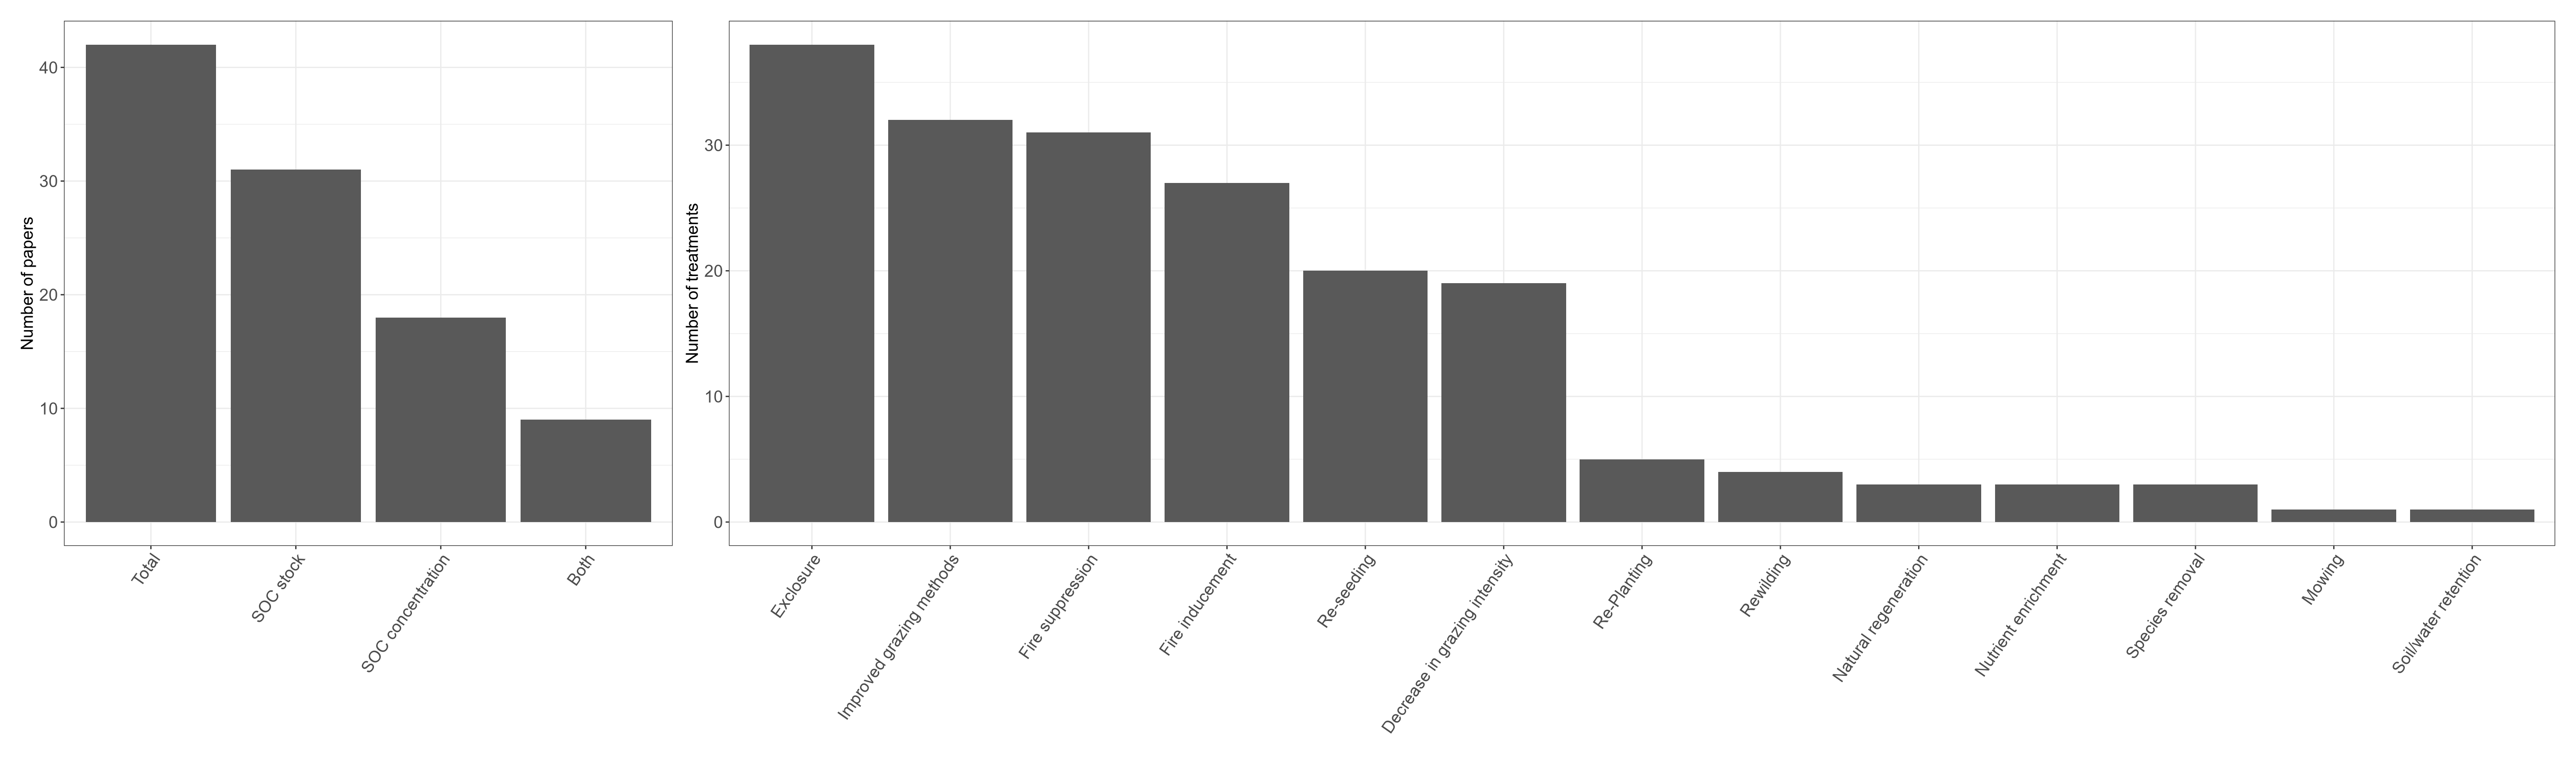
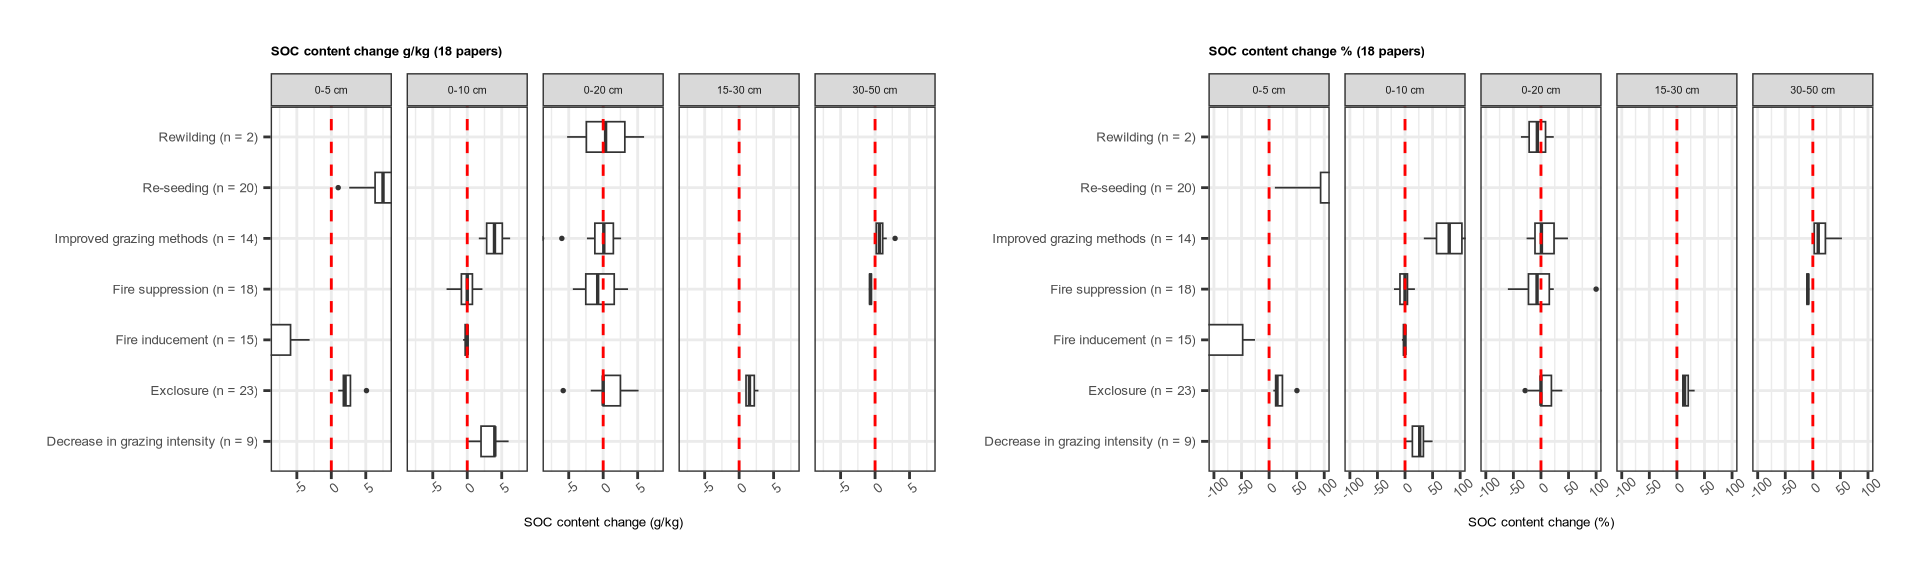
From the 42 reviewed papers, we extracted 193 different management treatments, which were grouped into 12 management groups. Most papers (32) reported on SOC stock changes (Mg/ha), 18 on SOC concentrations (g/kg), and only 9 papers reported on both. The most occuring practice was the establishment of exclosures, followed by improved grazing methods and fire management. The effects of invasive species removal, mowing and soil and water conservation on SOC were barely reported in the literature.
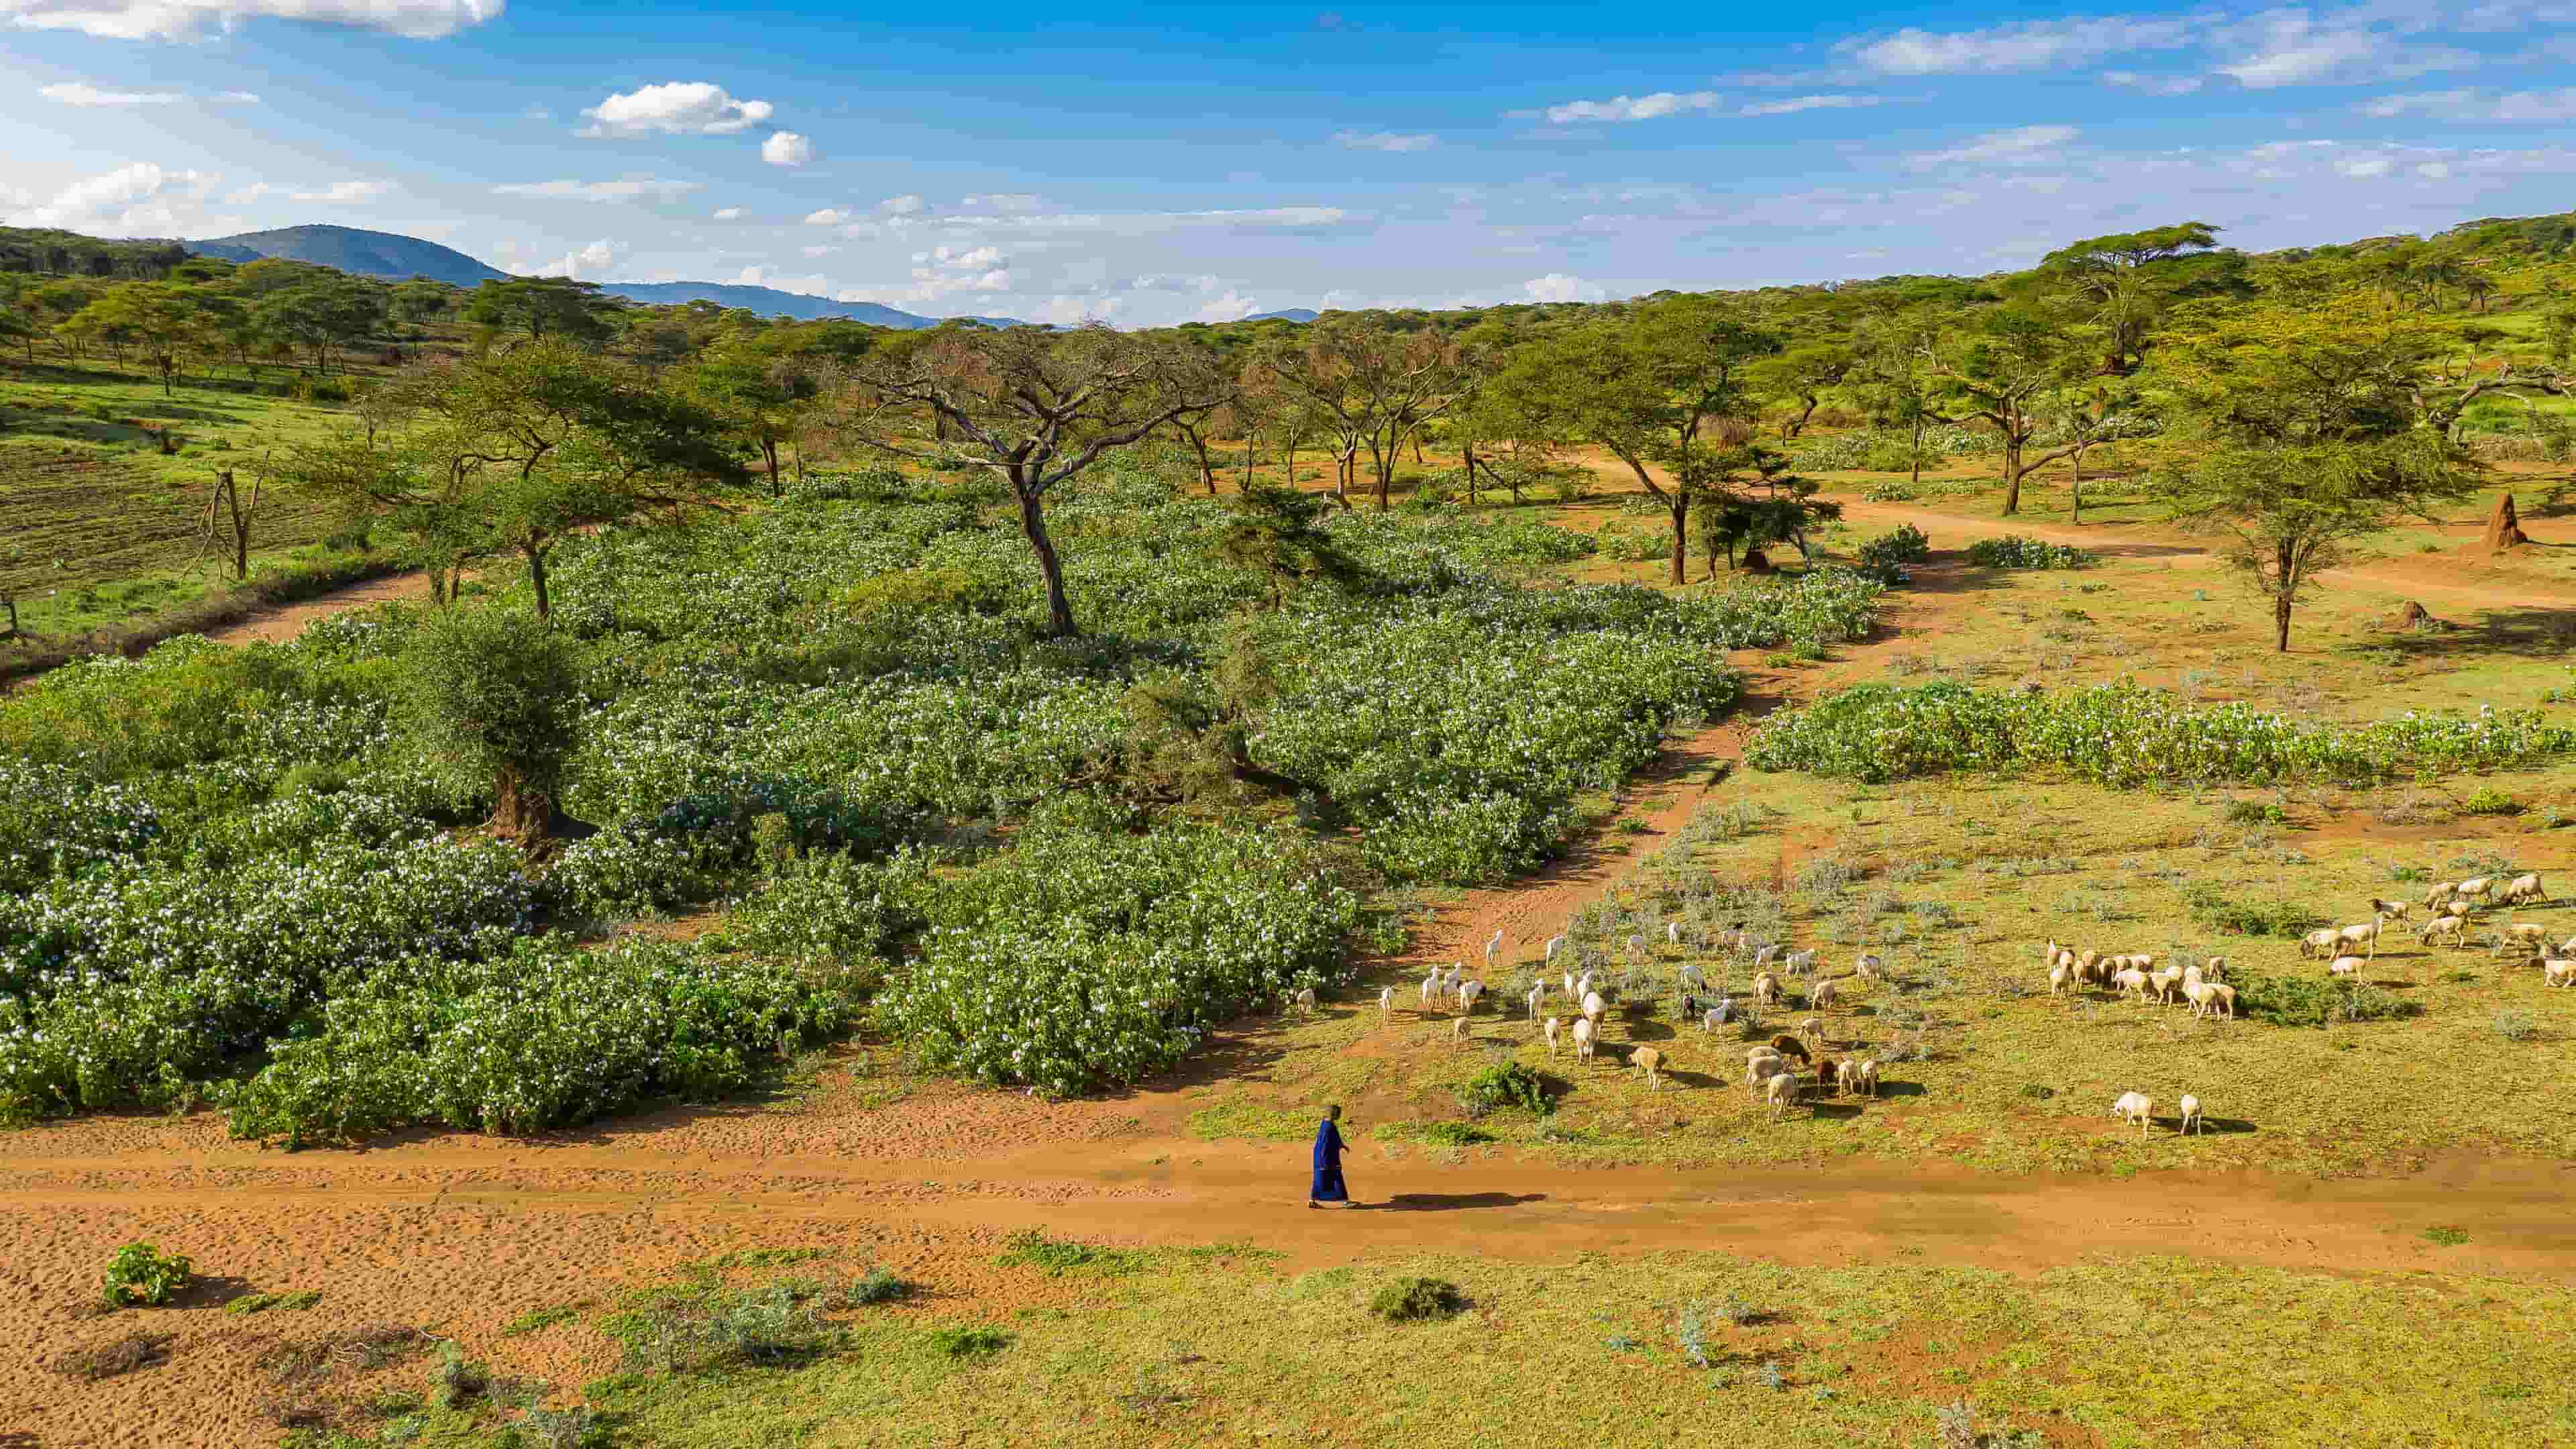
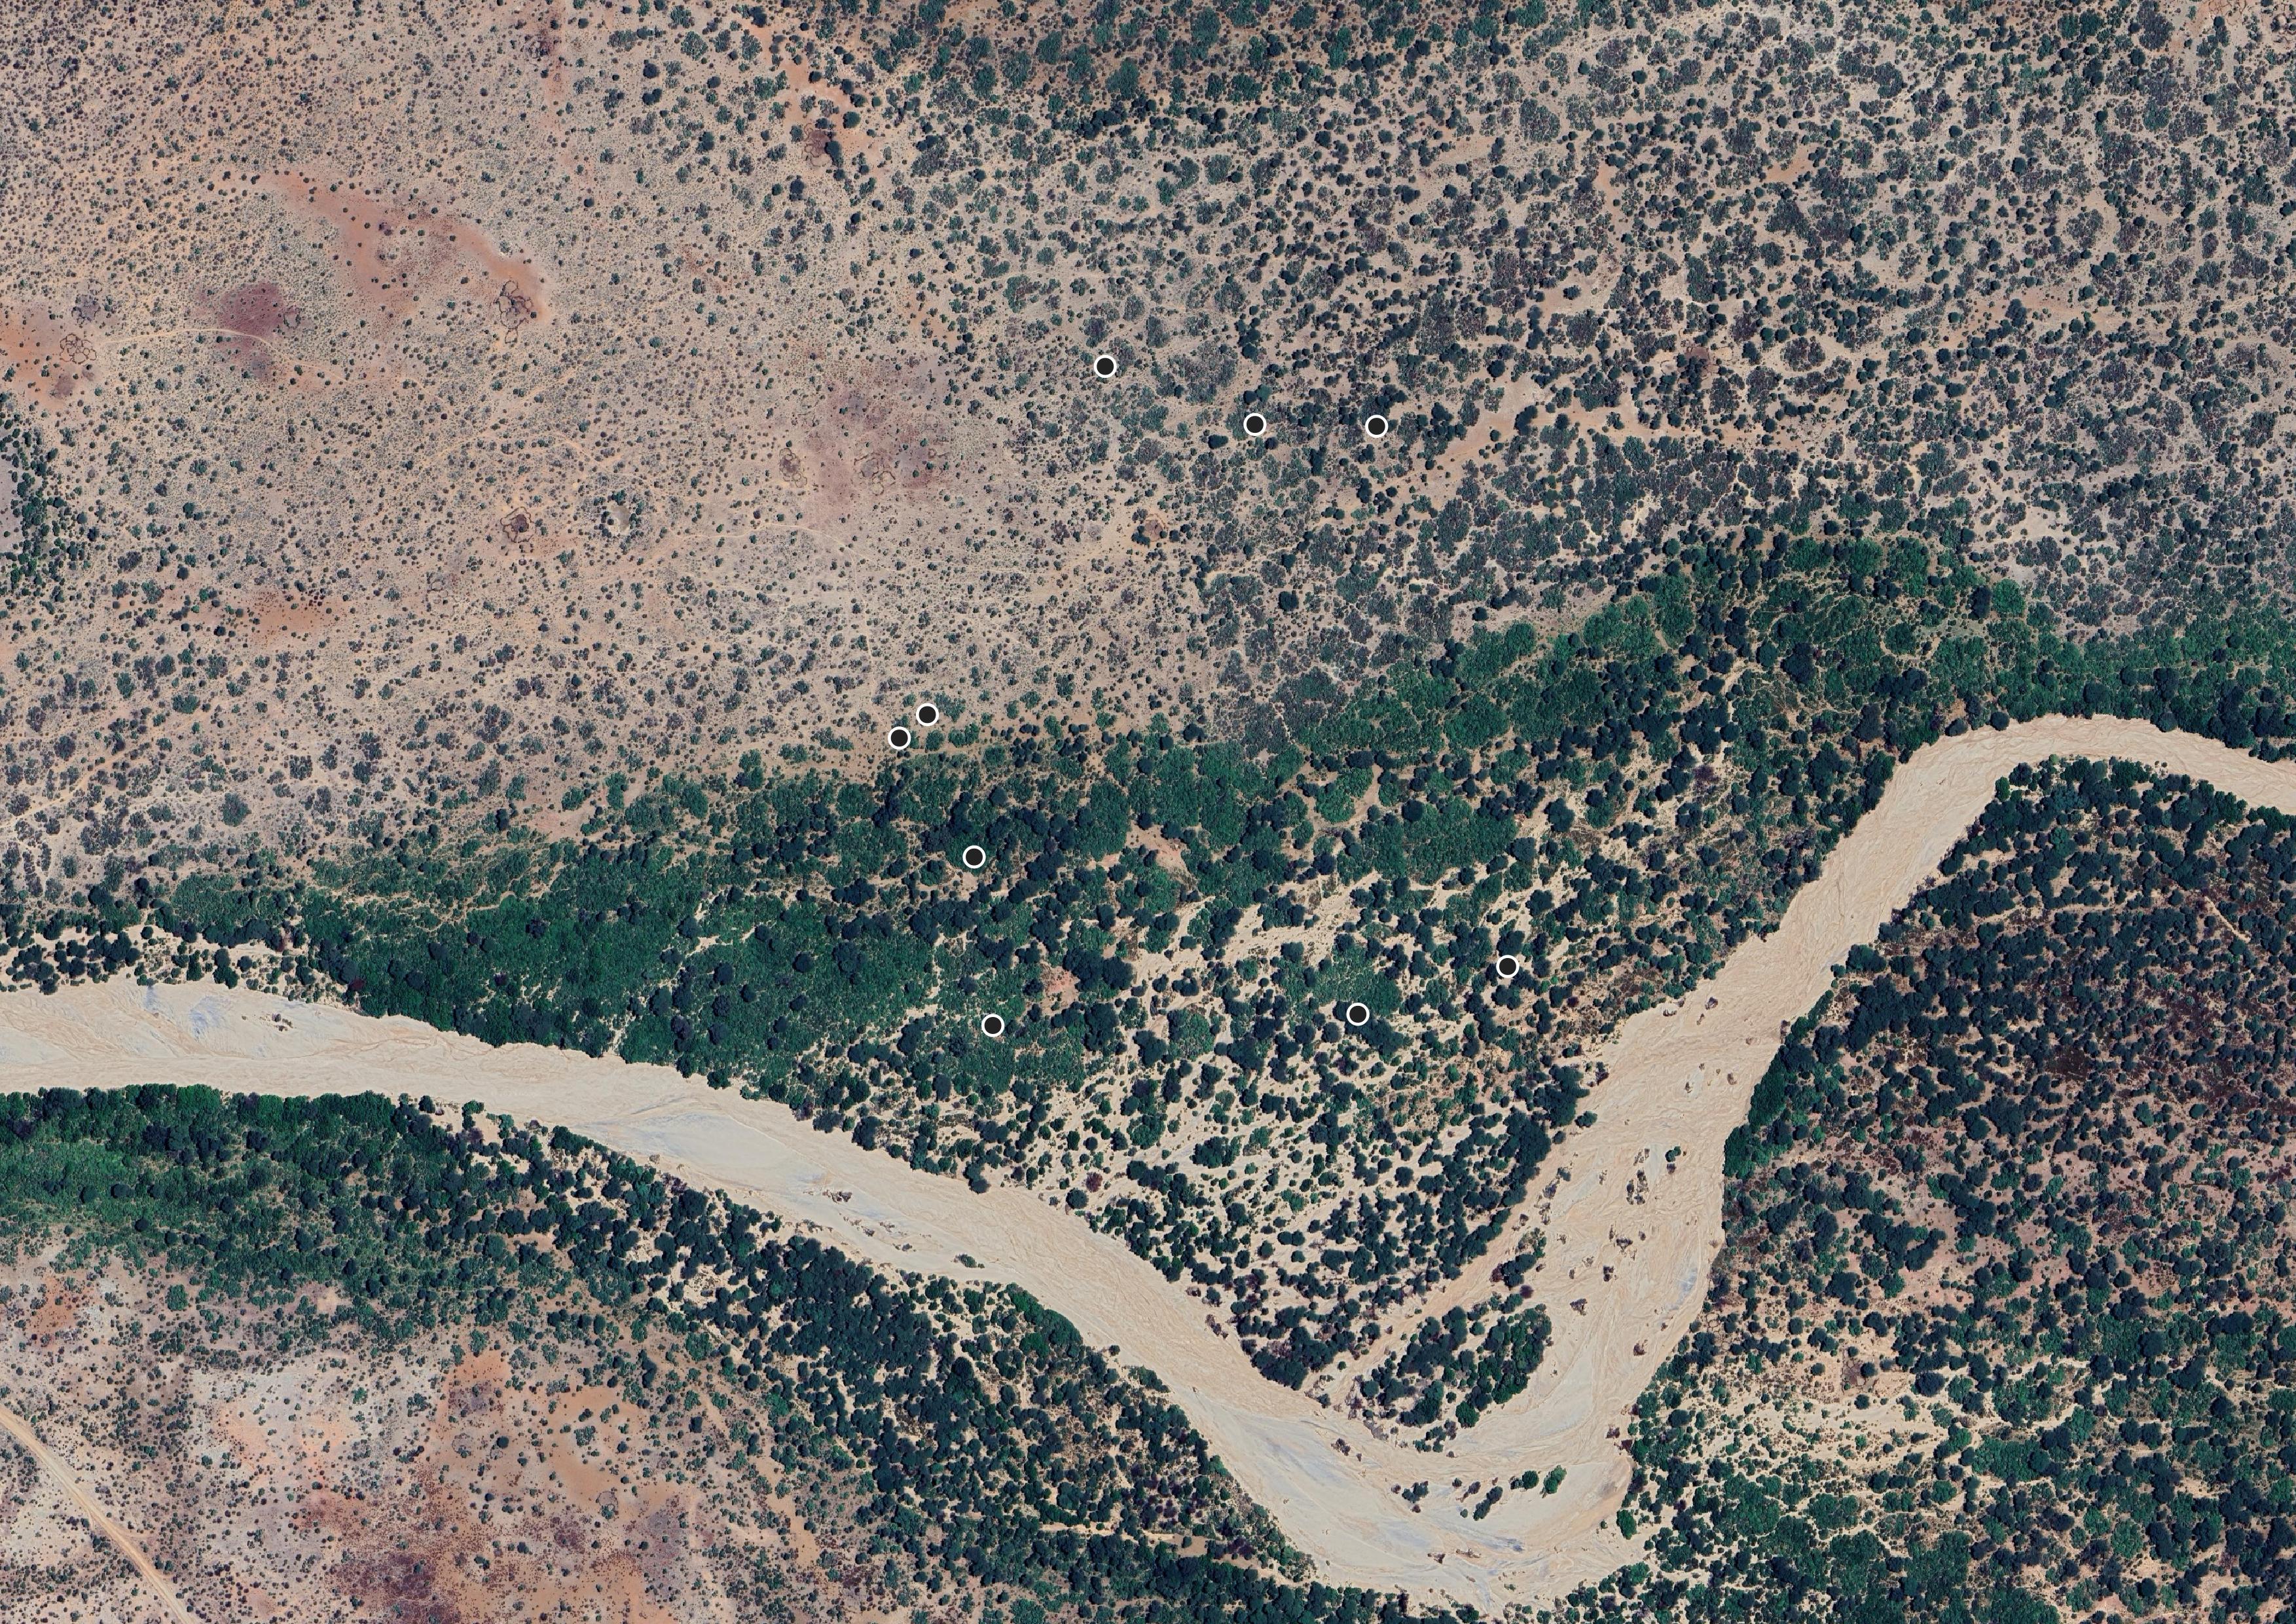
Our systematic review identified studies from diverse geographical locations, as shown in the map. The studies cover various aspects of rangeland management, including grazing management (blue markers), fire management (red markers), and restoration & rewilding initiatives (green markers). This spatial distribution helps us understand the global scope of rangeland management research and identify potential gaps in geographical coverage.
Most studies were conducted in South Africa (18 studies, 42.9%), Kenya (9 studies), and Ethiopia (5 studies). The relatively high abundance of studies from Southern and Eastern Africa, compared to Central and Northern Africa, partially reflects the distribution of savannas across the continent. However, it is important to acknowledge the presence of geographic bias in the dataset.
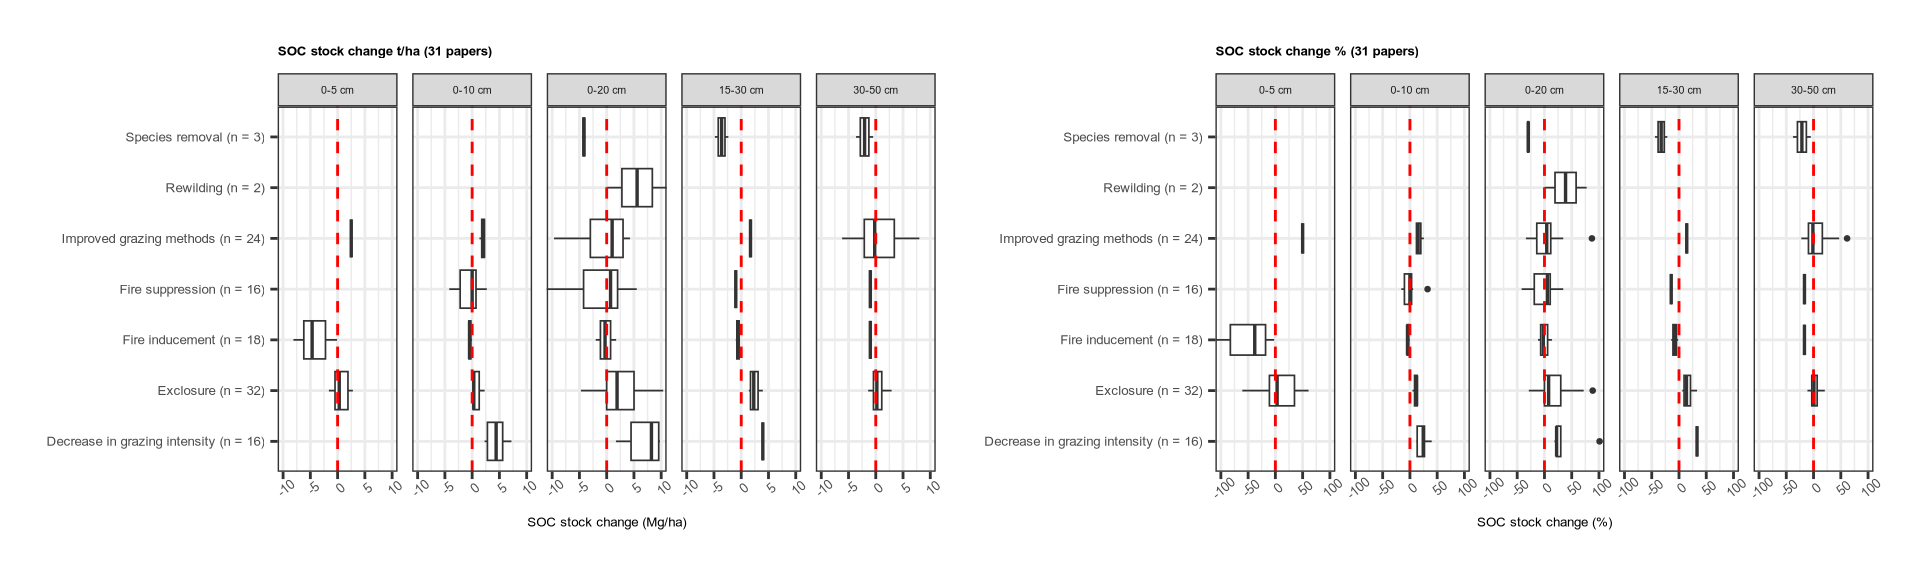
Exclosures and decreasing grazing intensity result in consistent positive impacts on SOC stocks across all depths measured. These trends tend to hold true for SOC concentrations as well.
Improved grazing methods often demonstrate positive impacts on SOC stocks, but significant variability in the 0-20 cm and 30-50 cm depths adds uncertainty. Likewise, SOC concentrations tended to increase under improved grazing methods but results were inconsistent.
Species removal and increased fires (fire inducement) tend to have negative impacts on SOC stocks across all measured depths, though the impacts of fire inducement are most significant at the soil surface.
Fire suppression has variable impacts, trending towards neutral to negative impacts on SOC stocks and concentrations.
Reseeding increases SOC concentrations, though data is only available for the top 0-5 cm.
Impacts of rewilding are positive on SOC stocks but variable for SOC concentrations, and difficult to interpret given the low sample size.
While evidence suggests that practices such as reduced grazing intensity and seasonal grazing exclusions can increase SOC stocks, results across studies are mixed, largely due to methodological inconsistencies, small sample sizes, and failure to account for key abiotic variables.
Key findings:
Grazing management was strongest related with SOC sequestration, especially strategies that reduce grazing intensity (+7.5 t/ha; +3 g/kg) and stimulate vegetation recovery through improved grazing methods (e.g. rotational grazing) (+1.5 t/ha; +3 g/kg).
Exclosures proved often effective to increase SOC stocks (+3 t/ha) and concentrations (+2.5 g/kg), though the effect was not always strong. Notably, exclosures limited other uses of the land, making it a costly measure.
Fire management yielded mixed results; Frequent fires generally decreased SOC in the topsoil (0-5 cm) (-5 t/ha; -8 g/kg) while fire supression did not lead to considerable changes.
Restoration practices such as rewilding (+5 t/ha) and reseeding (+7.5 g/kg) showed positive effects on SOC, though the number of experimental studies covering these interventions was limited.
Other findings:
Abiotic variables—including precipitation, temperature, and soil texture—strongly influence SOC dynamics but are often unreported or unaccounted for in research designs.
Soil depth considerations are critical; many studies ignore SOC variation with depth, limiting the reliability of stock assessments.
Stacked practices (e.g., grazing management + reseeding) remain understudied but show potential for synergistic SOC benefits.
Key challenges and recommendations:
- Monitoring SOC outcomes is hindered by:
- Sub-optimal (space-for-time) study design.
- Inconsistent sampling methodologies.
- Inadequate accounting for climatic factors.
- Lack of long-term remeasurement data.
- To improve SOC monitoring and project design:
- Use well-matched control-treatment sites and implement repeated measurements.
- Standardize soil sampling depths and methods.
- Incorporate climatic and soil data in experimental and analytical frameworks.
- Expand research on interactions among management practices.
This page shows the data extracted from the 42 included studies which underpins the D1 analysis and results. These indicators have been extracted through a thorough review process which was checked by multiple reviewers. The full dataset can be downloaded below for further use.
DSM products reviewed
13
DSM products included
4
Reference data n =
1191
The second deliverable aimed to get a better understanding of the current quality of remotely sensed SOC predictions for Africa. Specifically, the goals included:
- Identify the publically available Digital Soil Maps (DSMs) of Soil Organic Carbon (SOC) for Africa
- Assess the accuracy of the DSMs of Soil Organic Carbon (SOC) in Africa using a reference dataset
- Provide a set of recommendations for the use of DSMs of Soil Organic Carbon (SOC) in the context of the Voluntary Carbon Market (VCM)
A total of 13 DSM were reviewed of which 4 were selected detailed assessment.
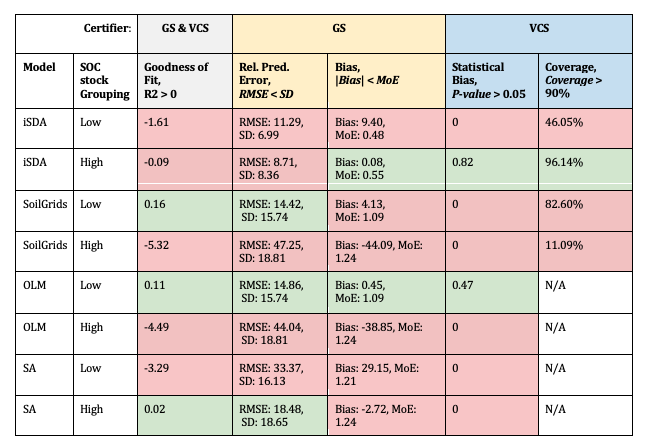
We evaluated the SOC Digital Soil Mapping (DSM) products using two newly released frameworks from leading Voluntary Carbon Market standards: Gold Standard’s SOC Model Requirements and Verra’s VCS DSM Tool. The table below presents the thresholds and criteria outlined by these frameworks, highlighting key similarities and differences in their minimum requirements for SOC monitoring.
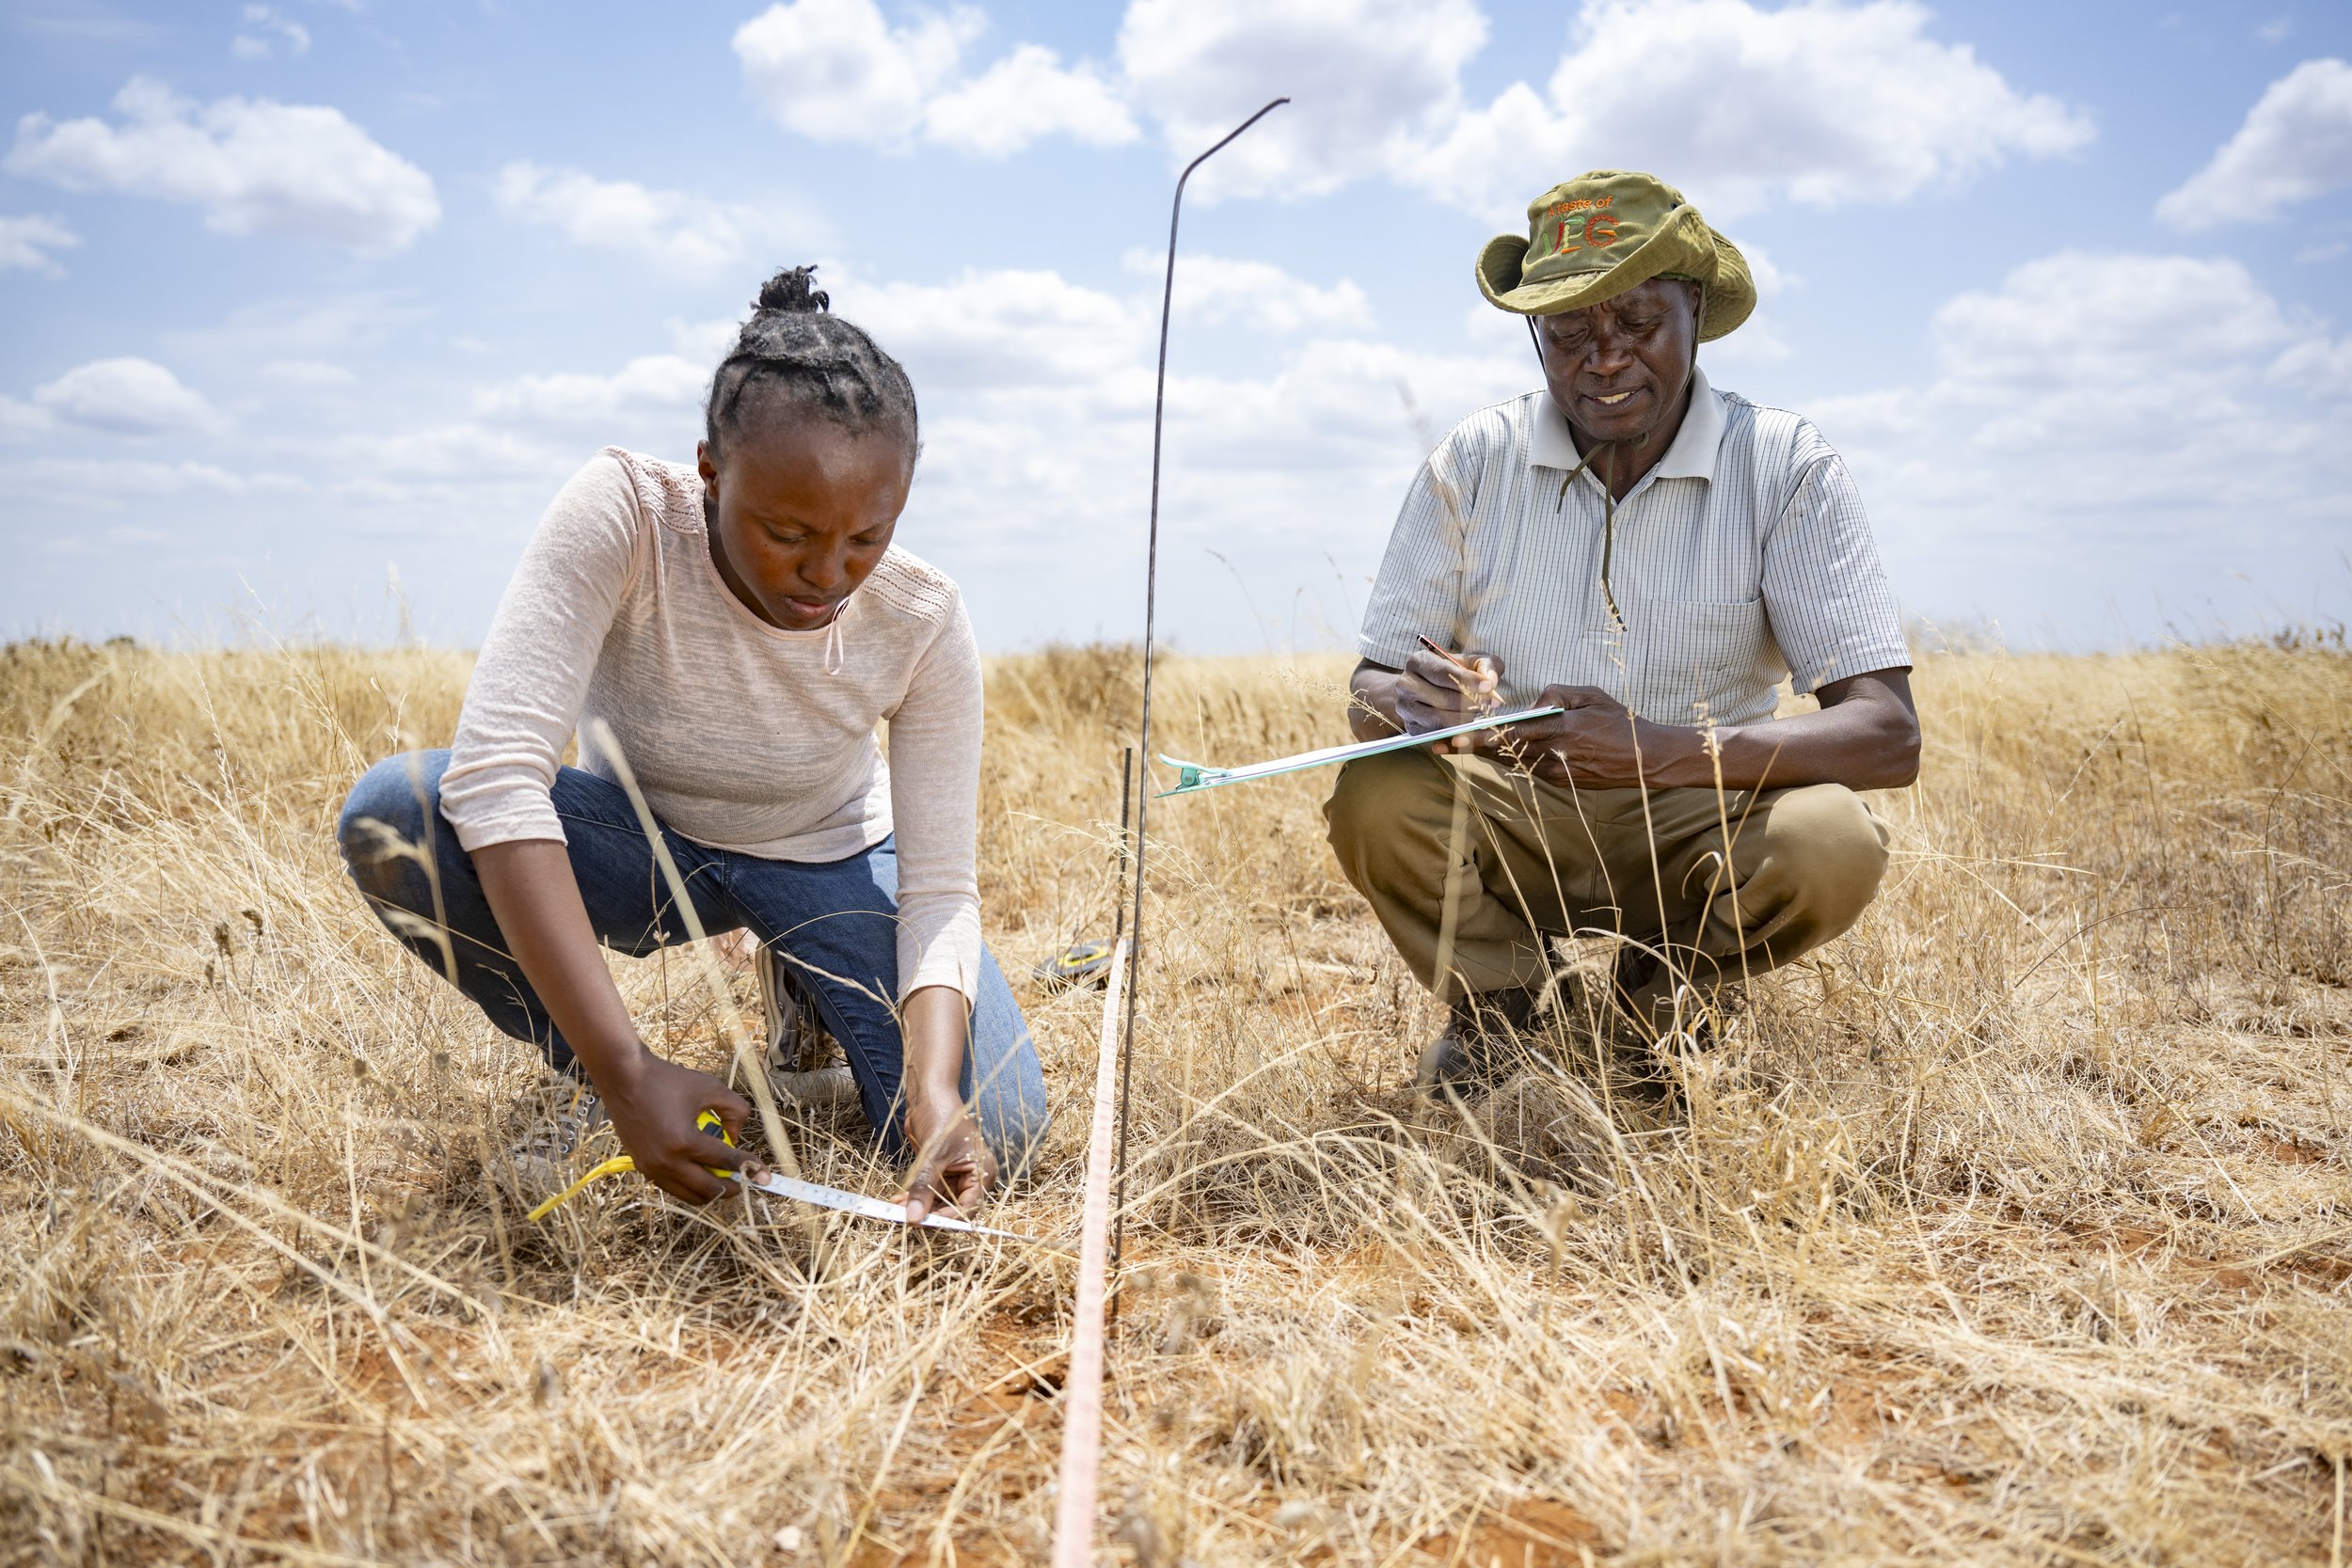
Reference soil samples were used to assess the accuracy of the shortlisted DSM products against an independent dataset. For this purpose, the World Agroforestry (ICRAF) provided 1,191 geo-referenced SOC samples collected under the Land Degradation Surveillance Framework (LDSF). The LDSF reference SOC samples were taken from the ICRAF database and included only samples collected from grassland/savanna regions to correspond with this report. The samples covered four sub-Saharan African countries: Kenya, Rwanda, Lesotho, Eswatini. The reference data was interpolated using two measurement depths (0-20 cm and 0-30 cm) to allign with the depths used in the modeled data. Lastly, the samples were collected during 2018 and 2019, in line with the time frame represented in the evaluated products.
More information on the LDSF reference data can be found here.
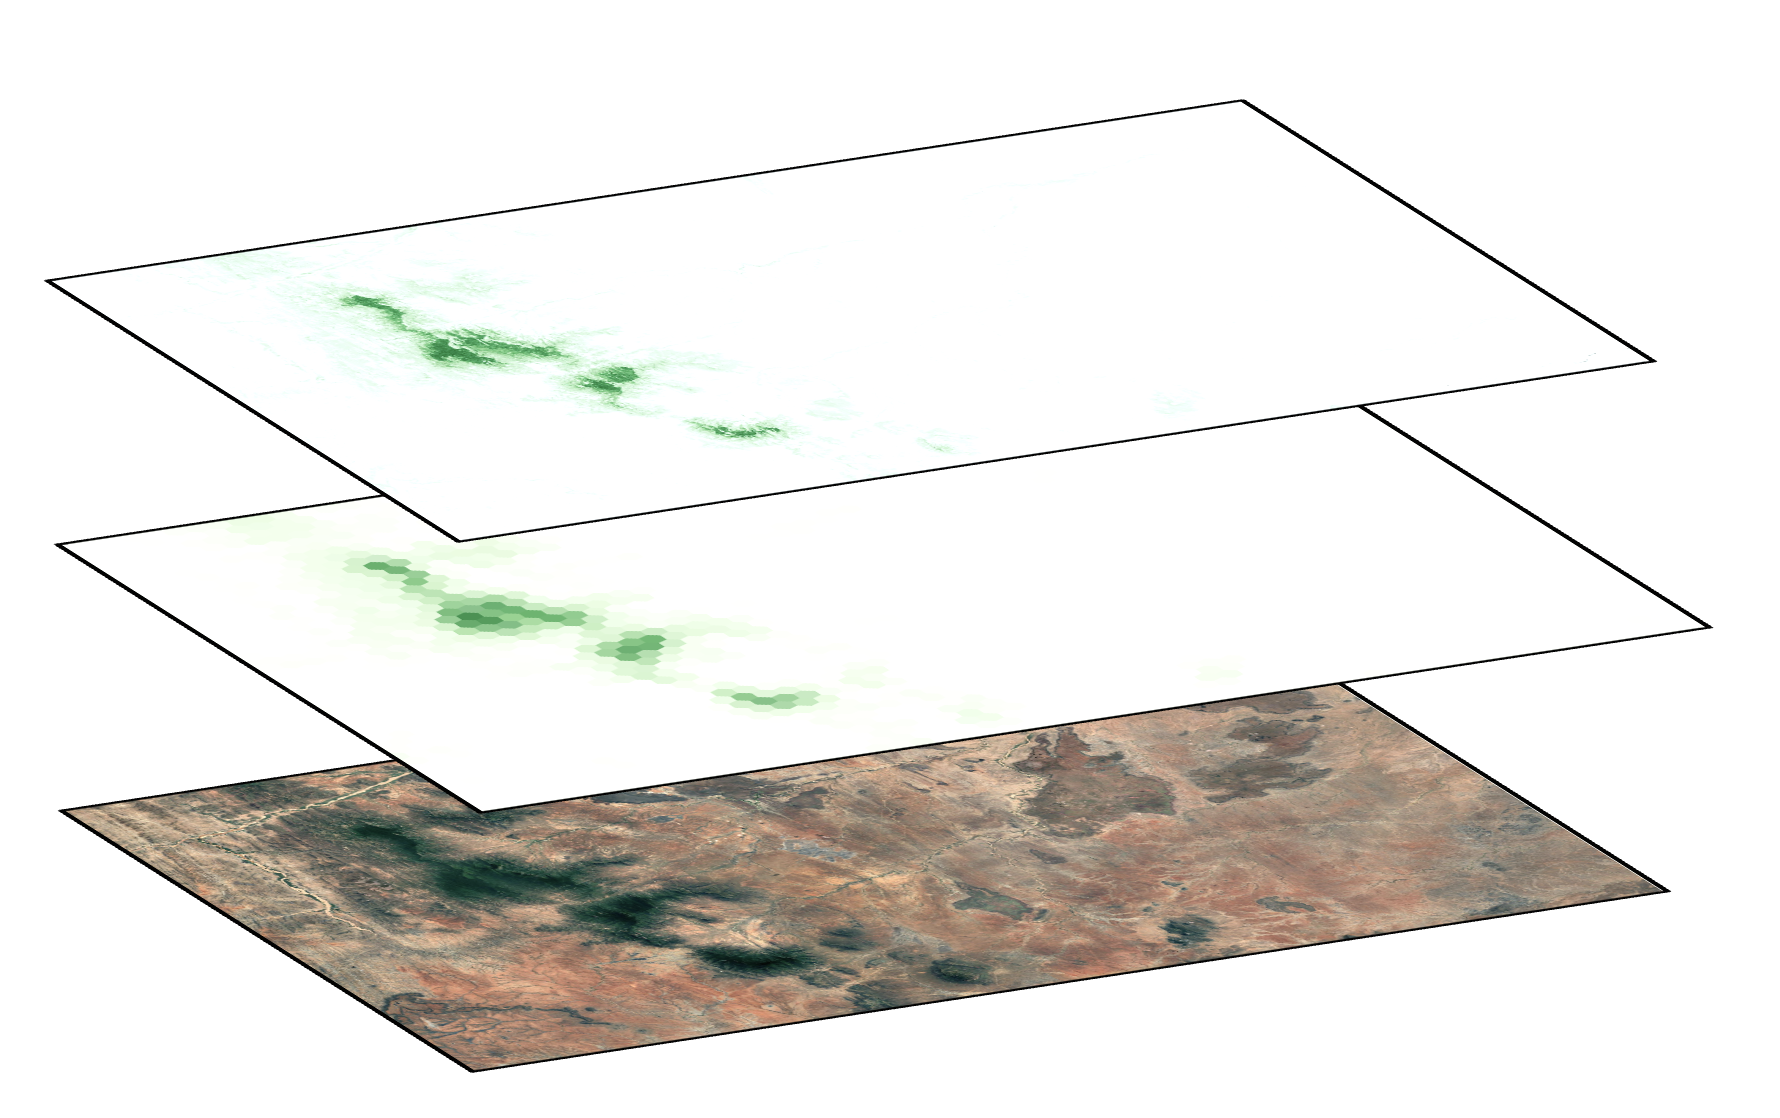
We observed that the range of SOC stock values nearly doubles when calculated at 30 cm compared to 20 cm. Among the products, the 30 m resolution iSDA model (at 20 cm depth) most closely matched the range and median of the soil samples. In contrast, SoilGrids and OpenLandMap (OLM)—both at a coarser 250 m resolution—tended to predict lower SOC stock values than those observed in the LDSF samples, while the 30 m South Africa DSM generally yielded higher values.
By splitting the data into low and high (>32 Mg/ha - 0-20 cm; >72 Mg/ha - 0-30 cm) SOC stock groups, we can look at the model performance under different circumstances. Generally, the results reveal that the DSMs struggle to capture the variation in SOC levels as reported by the reference ground measurements. The iSDAsoil predictions perform better in areas with high SOC (R^2: -0.09) compared to areas with low SOC (R^2: -1.61) as it overestimate the stocks at low levels. Similarly, the South Africa (SA) DSM performs better in high SOC areas but overestimatess SOC stocks at lower concentrations. In contrast, SoilGrids and OpenLandMap (OLM) demonstrate the reverse pattern, with relatively better performance at lower concentrations and a tendency to underestimate SOC stocks in high-concentration scenarios.
It is important to note that none of the products consistently performed well across ranges; the coefficients of determination are generally low—and in some cases even fall below –1. The table summarizes the product performance under the Gold Standard and Verra VCS validation criteria for both low and high SOC stock groups. The results show that iSDAsoil and the South Africa product meet more validation criteria in high SOC areas but fail to meet all criteria in low SOC regions. Conversely, SoilGrids and OLM tend to perform better in low SOC areas, with OLM even passing all applicable validation criteria in that range. It is important to re-emphasize that meeting these validation criteria does not imply a model is performing well overall. For example, although OLM passes GS validation in low SOC conditions, its R² remains very low (0.11), and its error is nearly as large as the variation in the observed data.
Literature was consulted to find the generally accepted accuracy of SOC DSMs in the scientific community. We see that the accuracy of the SOC maps depends on number of training data (n), image resolution and model optimisation. The table below summarizes the accuracy of the DSMs based on the literature.
General Performance of Public DSM Products
Public DSM models provide useful regional estimates and spatial patterns of SOC but lack the precision for project-scale quantification or change monitoring.
Performance diminishes when applied at finer spatial scales or when disaggregated by country, SOC class, or land cover.
Possible Reasons for Limitations
Modeling scale: Large-scale models are less tuned to site-specific conditions and land management practices.
Training data: Limited training data which does not reflect the conditions on the ground sufficiently reduces sensitivity to local variability.
Covariate resolution: Coarse environmental inputs mask local differences critical for detecting SOC changes.
Implications for Project-Level Use
Public DSMs are better suited for initial feasibility assessments, not for accurate carbon quantification or credit issuance.
Project-specific models, built with locally collected and time-specific data, offer greater accuracy and compliance with certification standards (e.g., Gold Standard, VCS).
Evaluation of Proprietary DSM Products
Proprietary tools using similar methods (e.g., Boomitra) are also limited by reliance on remote sensing and lack of local sampling, which raises concerns about reliability.
Projects should critically evaluate such tools and ensure validation with on-the-ground data.
Recommendations for Future DSM Use in Carbon Projects
Collect soil samples using standardized designs before project start and repeat over time.
Develop localized models using high-resolution, relevant covariates and ground-truthed data.
Conduct rigorous error assessments to quantify uncertainty and ensure credibility in MRV systems.
Conclusion
- Only rigorously validated, project-specific DSM models can meet the accuracy and accountability needs of carbon market certification.
Deliverable 3 aimed to assess the costs and benefits associated with improved SOC monitoring in carbon projects. Specfically, we set out to:
Compare Direct Measurement (DM), Biogeochemical Modeling (BGM), and Digital Soil Mapping (DSM) for Soil Organic Carbon (SOC) MRV, focusing on trade-offs between scalability, cost, and uncertainty.
Explore how improvements in accuracy may plateau and how uncertainty affects credit issuance, particularly regarding the potential of DSM to meet integrity requirements for carbon finance at scale.
Offer a practical framework with indicative cost estimates, simulated uncertainty deductions, and guidelines on where targeted investments (e.g., in sampling or modeling) may yield the most value for project feasibility.
Large and well-monitored changes in SOC stocks lead to a lower uncertainty deduction and, hence, greater revenues for the carbon project. Spefically, the factors driving the uncertainty deduction are:
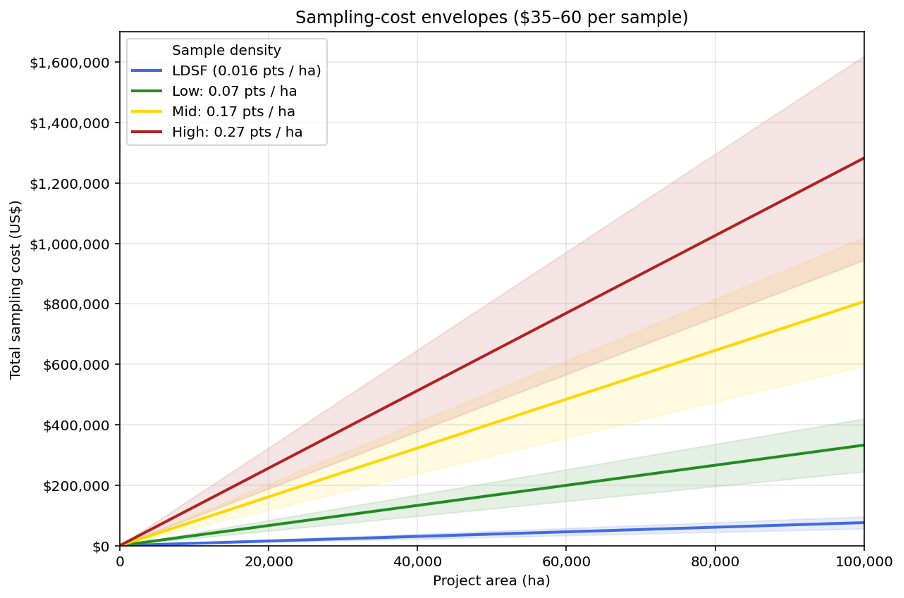
Robust monituring requires in-field sampling, data analytics which are resource intensive. For the sake of the cost-benefit analysis, we provide a cost estimate (USD) based on a typical LDSF sampling site. Though, costs may vary considerably based on accessibility, labour costs, transportation, special permites and more. Find below the estimate:
Large and well-monitored changes in SOC stocks lead to a lower uncertainty deduction and, hence, greater revenues for the carbon project. Spefically, the factors driving the uncertainty deduction are:
Recommendation for a high level/conservative estimate of soil sampling density for larger project: 0.07- 0.27 sample/ha
Long-term field data is essential and requires investment: DSM provides potential for scaling SOC monitoring, but requires high-quality, repeated field measurements to calibrate and validate models, particularly for detecting small incremental change through time across large areas.
Acknowledge DSM limitations: Existing DSM products, particularly publicly available ones, are useful for understanding spatial trends at regional scales but lack the precision required for accurate project-scale SOC quantification, and/or repeated estimates through time to evaluate change.
Be Cautious of Proprietary Models: Projects should be wary of proprietary models that do not provide transparent methods or robust validation with field-data.
Require Transparent Model Testing and Validation: DSM models must be rigorously tested against independent longitudinal SOC data utilizing the best available methodologies for spatial accuracy assessments.
Leverage Carbon Project Potential: SOC projects backed by committed funders can help close critical data gaps by generating the field data necessary for emerging DSM approaches.
Align with VCM Standards: As carbon standards evaluate and potentially adopt DSM, projects must demonstrate how model uncertainty and potential cost savings balance with monitoring rigor and credibility.
Plan for Long Monitoring Horizons: Given high uncertainty and small expected SOC gains in savanna systems, projects may need extended time frames or enhanced model precision to detect credible change.
Push for Open and Transparent Practices: Standards and funders should promote transparency in model inputs, calibration, validation, and uncertainty accounting.
Advance Innovation: While recognizing current limitations of DSM modeling approaches and the future potential, early adopters should commit to iterative and transparent development standards.